Density variation on a continuous polyurethane foam line rarely announces itself as a single dramatic event. More often, it shows up as two blocks cut from the same formula that feel different in the hand, core samples that drift outside specification, or a customer complaint that the foam performs softer than the approved sample. The chemistry may be unchanged. The equipment, however, has moved — usually by a fraction of a percent in ratio, temperature, or line speed.
In continuous slabstock production, apparent density is the result of mass delivered per unit of expanding foam volume. Because the reaction is fast and the line never stops, small process shifts accumulate continuously. The most useful way to investigate density variation is to treat it as a control-loop problem, not a formula problem. The sections below separate the causes that matter most, in the order an engineer should check them.
1. Metering Ratio Drift
The A/B component ratio is the highest-leverage variable on a continuous foam line. If the isocyanate or polyol side delivers slightly more than the setpoint, the reaction stoichiometry changes, water consumption changes, and final cell structure and density move with it [1]. A slow drift is especially dangerous because it may not alarm immediately; it produces several blocks of off-spec foam before an operator notices.
Common trigger points are worn pump elements, calibration drift, air trapped in the metering lines, day-tank level changes, and inlet pressure variations. A pump that holds its calibration on a bench test can still drift on a running line when the feed pressure changes or the material temperature shifts viscosity.
The first control is not to trust the setpoint alone. Periodic gravimetric calibration or mass-flow verification at the working viscosity is necessary. On automated lines, closed-loop servo metering with real-time ratio correction catches drift earlier than manual sampling, and ratio alarms should be tied to the line stop logic rather than to a warning lamp.
2. Material Temperature Variation
Polyol and isocyanate viscosity fall as temperature rises. If a tank heater, jacket, or recirculation loop lets temperature drift, the metering pumps deliver a different volume at the same speed. That alone can change the ratio even when the pump settings are correct. Temperature also changes cream time, rise profile, and blowing reaction kinetics [1].
This is why intermittent agitation and partial heating are not enough on a continuous line. Raw materials should be conditioned inside a controlled window before they reach the metering pumps, and the temperature should be measured at the point of delivery, not only in the day tank. A thermoregulator or heat exchanger that keeps temperature stable under recirculation matters more than the nominal setpoint printed on the HMI.
3. Mixing Quality and Air Loading
Density variation is not always a metering issue. Poor mixing changes how evenly the blowing reaction develops inside the rising foam. If the mixing head speed drops, the pins are worn, or the mixing chamber pressure is unstable, the cells can become coarse and irregular, shifting the weight per unit volume.
Nucleation air adds another layer. Controlled air injection produces fine, uniform cells; too much or too little air changes the foam’s density and tear behavior. In continuous slabstock, mixing head condition should be inspected on a schedule, not only after a defect appears. A pressure trend on the mixing head will often show instability before the block quality shows it.
Mixing head type also determines how much tolerance the process has for pressure and viscosity changes. <Polyurethane Foam Machine Types: Working Principle and Applications> explains where low-pressure and high-pressure mixing differ and why that choice affects density control.
4. Conveyor Speed, Pour Rate and Pour Pattern
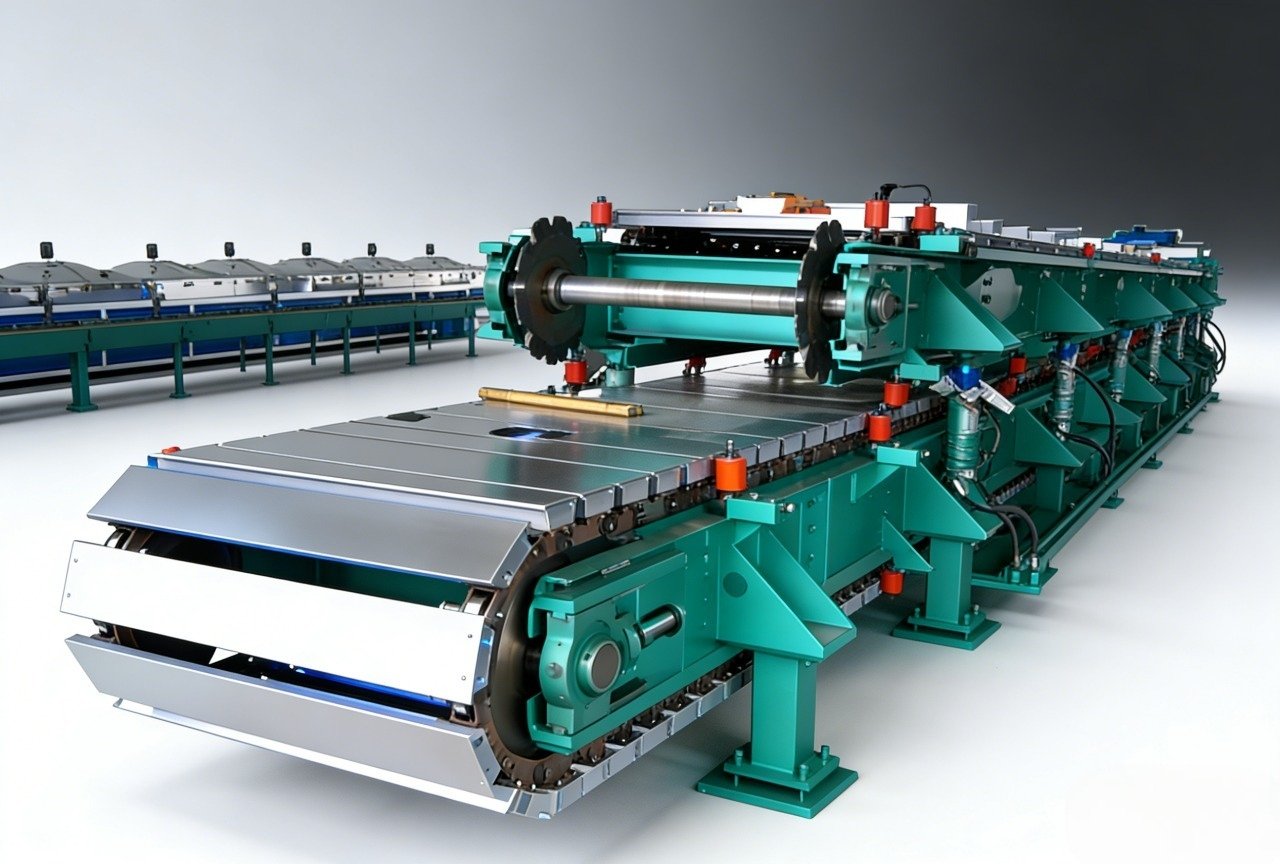
On a continuous line, the conveyor speed and the pouring output must stay in proportion. If the line speeds up without a matching increase in pour rate, the liquid is spread over a longer length and the resulting foam mass per meter falls. If the conveyor slows while pour output stays constant, the foam rises from a heavier liquid layer.
The pour pattern matters just as much. A narrow pour, an incorrect fall-plate angle, or uneven distribution across the trough creates dense edges or a non-uniform center. Operators sometimes adjust line speed to solve a rise problem, but that change also alters density. The two must be treated as one setting, not separate levers.
Density moves on a continuous line whenever line speed is changed without matching pour rate, mixing intensity, and cooling air. <Continuous PU Foam Line Capacity Guide: How Much Foam Can One Line Produce?> covers capacity calculation and the line-speed/density trade-offs in more detail.
5. Water Content and Blowing Efficiency
Water is the main chemical blowing agent in many flexible foam formulations. If the water metering system drifts, or if the raw materials pick up moisture from humid air, the blowing reaction changes and density moves. This is one reason why two companies can run the same nominal formula and get different results: their raw-material storage conditions are different.
The practical control is to verify water content in the polyol system and to calibrate the water or additive stream as carefully as the main components. Ambient humidity changes between shift or season should be considered a process variable, not a background constant.
6. Rise Profile, Cure and Block Development
Density variation can also develop after the pour. If the rising foam collapses slightly because of undercure, if the tunnel airflow is uneven, or if the block is cut before the core has cooled, the structure changes. The top-to-bottom density difference in a slabstock block is a normal physical effect, but it should be predictable and within the product specification.
A sudden change in top-to-bottom density often points to cooling air, cure rate, or line speed changes rather than a metering fault. Measuring density at fixed sample positions over time tells you whether the distribution is drifting or simply following the expected profile.
7. Sampling and Measurement Error
Finally, some density variation is not in the foam at all. Apparent density depends on skin, cell structure, sample size, and how the sample is cut. If the laboratory method changes between operators, or if core samples are taken from different locations, the data will exaggerate the true process variation.
The measurement should follow a defined method. ISO 845 defines how apparent density is determined for cellular plastics, and ASTM D3574 includes slabstock foam test methods that support consistent sampling and conditioning [2][3]. Before chasing an equipment problem, confirm that the reported density difference is larger than the measurement error.
| Cause | Typical symptom | First check |
|---|---|---|
| Metering ratio drift | Block-to-block density shift | Gravimetric calibration at working viscosity |
| Temperature drift | Shift-dependent or seasonal variation | Temperature at pump inlet, not only tank |
| Poor mixing or air load | Coarse cells, irregular density profile | Mixing head pressure and RPM trend |
| Conveyor speed mismatch | Density changes after line-speed change | Pour rate vs line speed correction |
| Water/humidity change | Density shift without ratio change | Water stream calibration and raw-material moisture |
| Rise/cure change | Top-to-bottom or surface density change | Tunnel airflow and cure before cutting |
| Measurement error | Variability with same foam | Sample location and method against ISO 845 |
Inquiry Route for Continuous Slabstock Lines
If you are seeing block-to-block or within-block density shifts and need a metering and line-sync audit, contact Haifeng Polyurethane Machinery at info@haifeng-automation.cn or WhatsApp +86 13566296633. The most useful starting information is the target density range, the current A/B ratio stability, the sampling points you use, and the line-speed range you are running. That is usually enough to narrow the cause list from seven possibilities to two or three before a site visit.
FAQ
Why does density vary between the top and bottom of a continuous foam block?
Some top-to-bottom density difference is inherent because the rising foam supports its own weight, and drainage and cooling affect the upper and lower regions differently. The problem is not the difference itself but a change in the difference over time. If the top-to-bottom spread increases, check tunnel airflow, cure rate, conveyor speed, and whether the block is cut before core cooling is complete.
Is density variation mainly a chemistry problem or an equipment problem?
In continuous production, a stable formula can still produce variable density when the metering, temperature control, mixing, or line-speed synchronization drifts. That makes equipment and process factors the first place to look. Chemistry changes usually come after raw-material lot changes, storage problems, or a deliberate reformulation.
How many samples should we cut to check density on a continuous line?
There is no single number, but one core sample per block is rarely enough. A better approach is to fix three or more sampling positions across the block cross-section, cut samples at the same depth each time, and track them over blocks and shifts. Consistent sampling under ISO 845 or ASTM D3574 methodology gives data that can separate real process drift from measurement noise [2][3].
References
[1] G. Oertel, Ed., Polyurethane Handbook, 2nd ed. Munich, Germany: Hanser Publishers, 1994.
[2] Cellular Plastics and Rubbers — Determination of Apparent Density, ISO 845:2006, International Organization for Standardization, Geneva, Switzerland, 2006.
[3] Standard Test Methods for Flexible Cellular Materials—Slab, Bonded, and Molded Urethane Foams, ASTM D3574-17, ASTM International, West Conshohocken, PA, USA, 2017.
If you’re interested, check out these related articles:
Continuous PU Foam Line Capacity Guide: How Much Foam Can One Line Produce?
PU Rain Boot Production Technology Explained